
LinkedIn Ads Benchmarks 2026: Compare the Right Cohort
Calculate one LinkedIn campaign cohort, test whether a benchmark row truly matches, and export the evidence behind the decision.
Use the workspace to calculate one campaign cohort, reject benchmark rows that do not match, and export the comparison with its sources and next check.
Download the comparison kit
Start with your own numbers
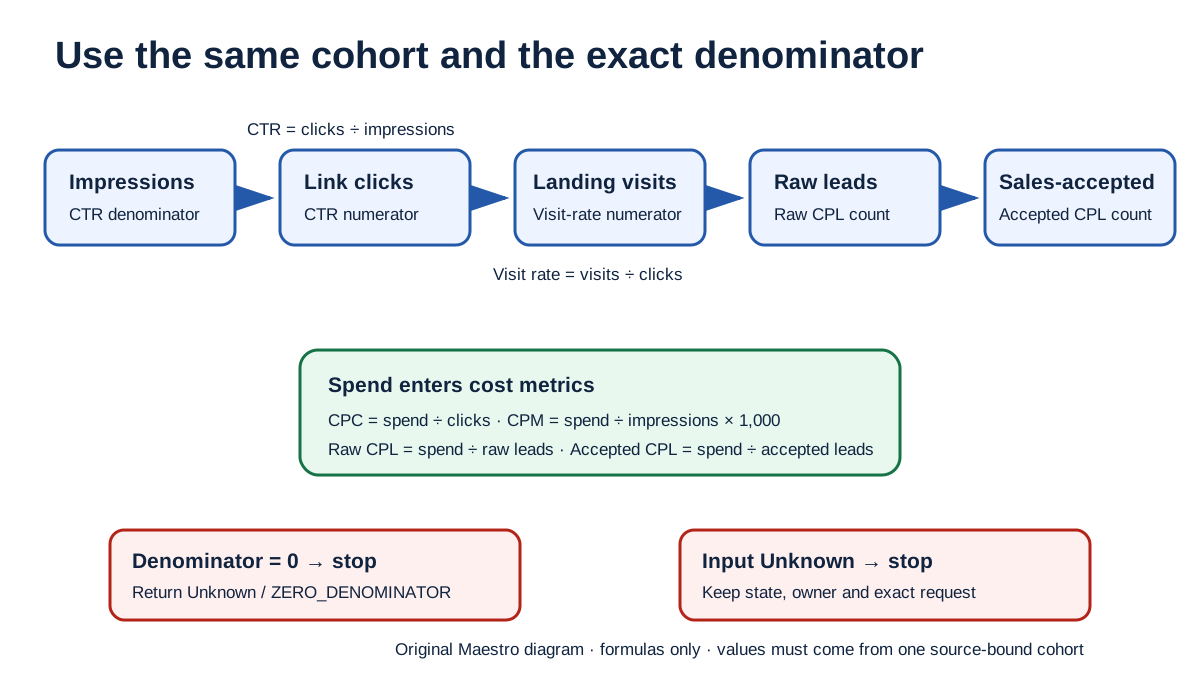
Enter the raw values from one LinkedIn campaign or ad set. The workspace calculates the rates for you:
CTR = chargeable clicks / impressions
CPC = spend / chargeable clicks
CPM = spend / impressions × 1,000
visit rate = landing-page visits / chargeable clicks
raw CPL = spend / raw leads
sales-accepted CPL = spend / sales-accepted leads
Do not type a calculated CTR or CPL into the final record. Give the workspace the numerator and denominator so another person can reproduce it.
A NO_DEFENSIBLE_COMPARISON result means the account metric is valid, but none of the available benchmark rows matches its period, definition, objective, format, audience, destination, attribution or aggregation closely enough for a direct comparison.
Use the benchmark workspace
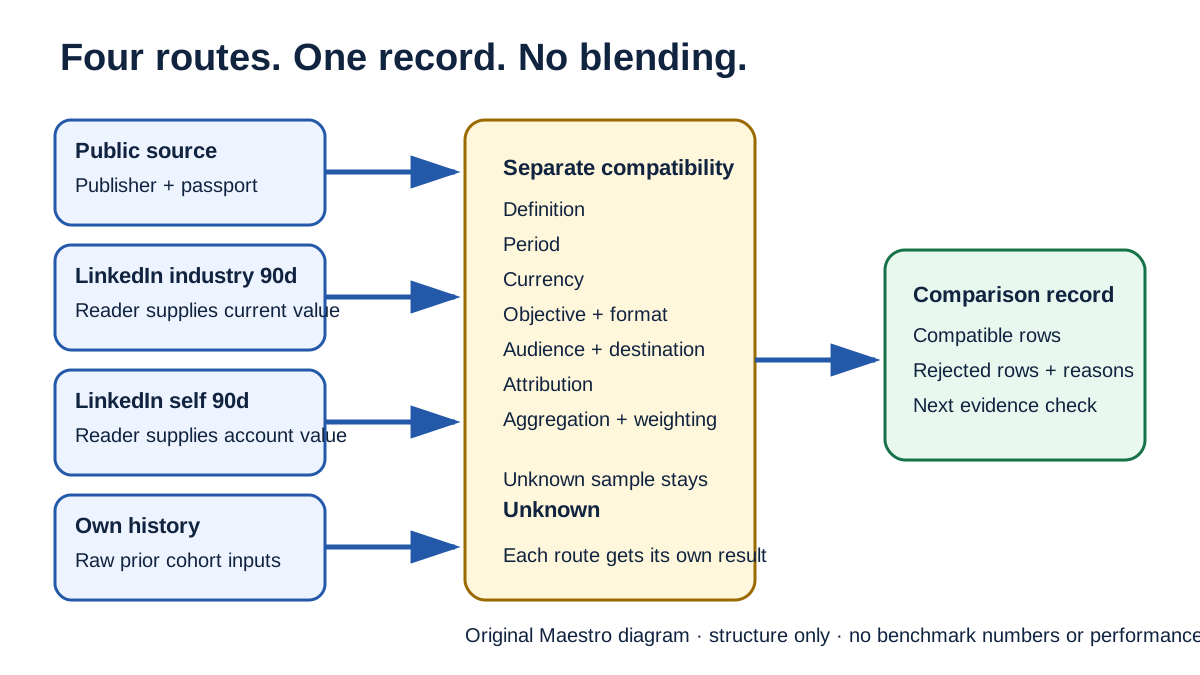
Choose one metric and one comparison route:
- LinkedIn industry, last 90 days. Use the industry benchmark shown for a similar ad set in Campaign Manager. Record the metric, observed date, peer label and an account-safe evidence reference.
- LinkedIn self, last 90 days. Use the benchmark for similar ad sets in the same account. Keep the account boundary and observed date with it.
- Own history. Load a previous cohort with the same raw inputs and definitions. The workspace recalculates both periods.
- Public source. Use a row whose publisher, period, sample, weighting, currency and metric definition are attached.
The four routes stay separate. The tool does not average them, translate currencies or turn a public number into a Maestro benchmark.
Start with LinkedIn's native industry or self comparison when Campaign Manager shows one. LinkedIn says the industry option compares similar ad sets with industry peers over the last 90 days. The self option compares similar ad sets from the same account over the last 90 days. LinkedIn does not publish the peer sample, weighting or exact similarity dimensions on the public help page, so preserve the current account evidence instead of trying to reconstruct the number.
Compare one campaign
Check your LinkedIn campaign against the right benchmark
Enter one campaign, choose where the comparison came from, and get either a defensible comparison or the exact evidence you still need.
1. Enter one campaign
2. Choose the comparison
Account dates and definitions
Custom source details
Earlier campaign period
Technical record and import fields
A benchmark row needs a source passport
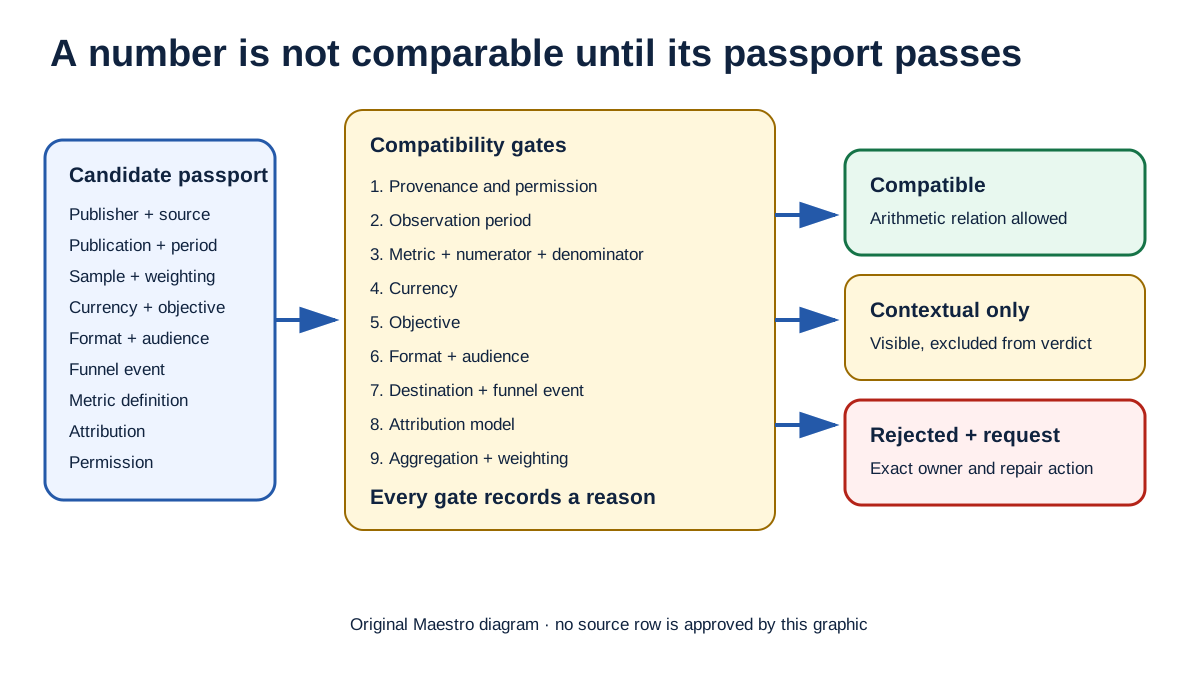
A useful row needs more than a metric and a year. Keep these fields with it:
- publisher and primary source URL;
- publication date and observation period;
- sample size and sample definition;
- weighting and aggregation method;
- currency and geography;
- objective, format and audience temperature;
- destination and funnel event;
- numerator, denominator and attribution definition;
- permission or licence status.
A known number with an unknown definition is still a poor comparison. Unknown is not zero. It is also not a conflict. The workspace preserves missing, unknown and conflicting facts separately and names the exact evidence request for each one.
Current public LinkedIn benchmark rows
The strongest reusable numeric source we found is Metadata's 2026 B2B Paid Media Benchmark. The direct CSV is published under CC BY 4.0. Metadata says its calendar-year 2025 dataset covers 153 B2B advertisers, $57.6 million in spend and 211,000 leads. Each published media cut has at least five advertisers and $50,000 in spend, and no advertiser contributes more than half of a published media figure. The numbers are spend-weighted aggregates.
These are selected LinkedIn rows from that dataset:
| Cohort cut | Advertisers | CTR | CPC | CPM | Click-to-lead | CPL |
|---|---|---|---|---|---|---|
| LinkedIn overall | 138 | 0.67% | $9.39 | $63.19 | 5.9% | $202 |
| Lead Gen Form destination | 97 | 0.61% | $11.93 | $72.53 | 6.2% | $193 |
| Landing-page destination | 100 | 0.58% | $8.12 | $47.44 | 3.0% | $346 |
| Native prospecting audience | 73 | 0.65% | $9.47 | $61.58 | 6.8% | $185 |
| Retargeting audience | 81 | 0.70% | $9.85 | $68.73 | 4.5% | $234 |
| Single-image format | 127 | 0.66% | $8.90 | $58.83 | 5.2% | $200 |
| Video format | 81 | 0.47% | $13.10 | $61.91 | 5.1% | $265 |
| Document format | 51 | 1.23% | $5.87 | $72.47 | 11.9% | $142 |
| Carousel format | 44 | 0.54% | $6.73 | $36.31 | 1.4% | $668 |
Treat each row as a source-labeled reference. The publisher does not supply geography, an exact attribution window, the complete lead taxonomy, the objective mix or the underlying advertiser mix for these cuts. A format row also pools destination and audience types. Those Unknown fields may make the row contextual rather than directly comparable with your campaign.
Do not compare a spend-weighted aggregate with a median advertiser as if they are the same statistic. Large spenders have more influence on a spend-weighted result. A median describes the middle advertiser after advertisers are ordered by their own result.
Match the denominator before the number
LinkedIn defines Average CTR as chargeable clicks divided by impressions. The chargeable click depends on the ad set objective. Average CPC is spend divided by clicks. Average CPM is spend divided by 1,000 impressions.
Other familiar rates use different denominators. LinkedIn defines conversion rate as conversions divided by clicks. Lead form completion rate is form submissions divided by form opens. A form open is not a chargeable click, and a raw lead is not a sales-accepted lead.
Two credible sources can disagree because they cover different periods, formats, objectives, destinations, currencies, event definitions or advertiser populations. The workspace checks those fields before it compares the values.
Worked example: cold single-image content offer
Synthetic example. No Maestro or client campaign result is used.
A fictional software company ran one cold, single-image content campaign from 1 September through 30 September 2026. It spent $9,600 in USD and recorded 1,200,000 impressions, 7,800 chargeable clicks, 5,100 landing-page visits, 52 raw leads and 14 sales-accepted leads.
The workspace recomputes:
CTR = 7,800 / 1,200,000 = 0.65%
CPC = $9,600 / 7,800 = $1.23
CPM = $9,600 / 1,200,000 × 1,000 = $8.00
visit rate = 5,100 / 7,800 = 65.38%
raw CPL = $9,600 / 52 = $184.62
sales-accepted CPL = $9,600 / 14 = $685.71
The public Metadata single-image row reports a 0.66% CTR and a $200 CPL. It is not a direct grade for this campaign. The source period is calendar 2025, while the account period is September 2026. The public row pools objectives, destinations and audience temperatures, and its exact click and lead taxonomy is not disclosed. The correct result is NO_DEFENSIBLE_COMPARISON for a direct public-source grade.
The next check is specific: open the ad set in Campaign Manager, choose the industry benchmark for Average CTR, preserve the current 90-day peer comparison and confirm that the account export uses chargeable clicks for the same ad set. Then rerun the workspace through the native industry route.
The public rows still help with source discovery. They do not prove that the creative, targeting or lead quality is good.
Worked example: warm demo campaign with a self benchmark
Synthetic example. The benchmark observation is fictional and demonstrates the record format.
A warm, single-image demo campaign spent $18,000 in USD from 4 July through 1 October 2026. It recorded 600,000 impressions, 4,200 chargeable clicks, 3,000 visits, 90 raw leads and 27 sales-accepted leads.
CTR = 4,200 / 600,000 = 0.70%
raw CPL = $18,000 / 90 = $200
sales-accepted CPL = $18,000 / 27 = $666.67
For this fictional record, assume Campaign Manager showed the account's $200 raw CPL as 10% below its current 90-day self comparison. The record keeps that observed direction and percentage, the observation date, the account boundary and an evidence reference. It does not derive an undisclosed peer CPL. That native self route can become comparison-ready even though the public rows remain contextual. The example does not claim that LinkedIn discloses the peer weighting or advertiser mix.
The next check is not “increase spend.” Recapture the raw-CPL relation in Campaign Manager with its current 90-day window, account boundary and observation date. Then open the CRM for the same cohort and review the 63 raw leads that did not become sales-accepted leads. Confirm the raw-lead and sales-accepted definitions, matching period and rejection reasons before changing creative or budget.
The examples lead to different results. The cold content example needs current native comparison evidence. The warm demo example already has a compatible self comparison and routes the next check to CRM acceptance.
What each mismatch tells you to check
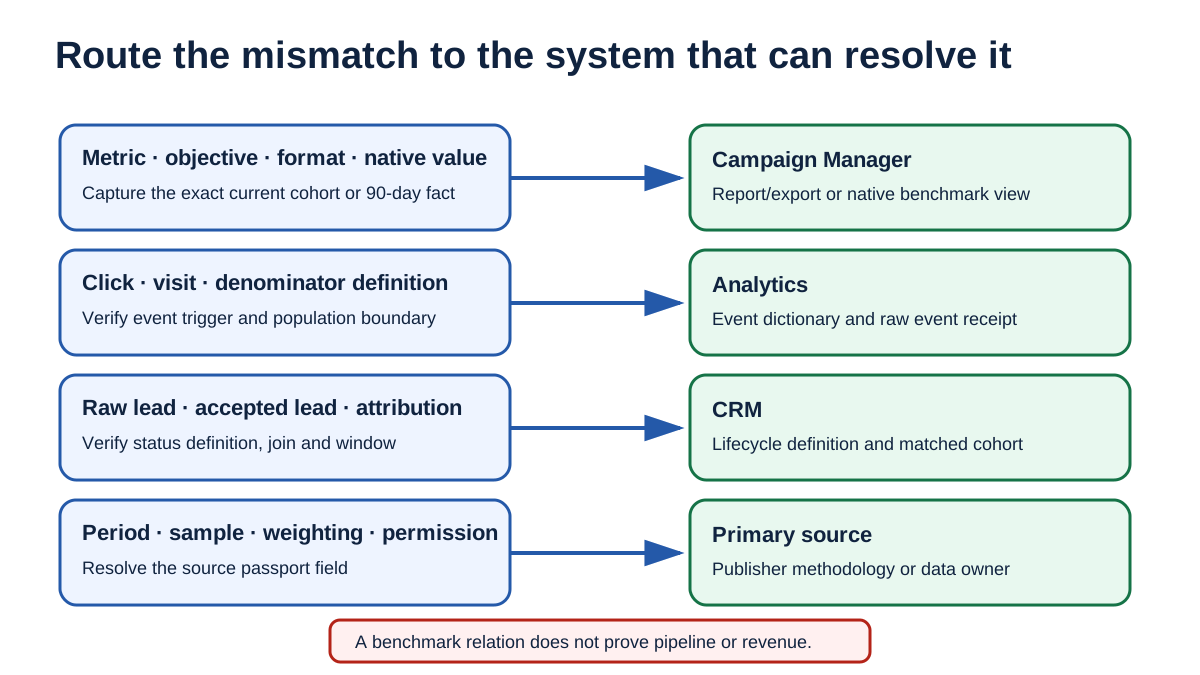
| Mismatch | Owning system | Next check |
|---|---|---|
| Metric, objective, format or native benchmark | Campaign Manager | Export the exact ad set, objective, format, metric and observed comparison date. |
| Click or visit definition | Campaign Manager and analytics | Match chargeable clicks to the landing-page visit or session event used in analytics. |
| Raw lead versus sales-accepted lead | CRM | Record both definitions, the join key, cutoff and unmatched population. |
| Currency | Finance or paid-media reporting | Normalize outside this tool and preserve the rate, date and owner. |
| Source period, sample, weighting or aggregation | Primary publisher | Retrieve the methodology or keep the row contextual. |
| Attribution model or window | Campaign Manager and CRM | Match the model, window and outcome cutoff before comparing conversion metrics. |
One mismatch should produce one evidence request. Do not turn a list of unknowns into a generic instruction to optimize the campaign.
Do not use forecasts as achieved benchmarks
LinkedIn says forecasted results use the objective, audience, format, bid, budget, schedule, historical account performance and similar advertisers. It also warns that forecasted spend, key-result and cost-per-result ranges are generated independently and may not reconcile arithmetically.
A forecast is useful during planning. It is not an observed result and does not belong in an achieved-performance comparison.
Export the record before you act
The workspace exports the same decision in three formats:
- JSON is the lossless, hash-bound record for reimport.
- CSV is a long-form audit table containing account facts, source facts, compatibility gates, requests and hashes.
- Markdown is the readable handoff for paid media, analytics, revenue operations and finance.
The export keeps selected and rejected rows. It also keeps the numerator, denominator, source passport, exact mismatch, owner and next action. Reimporting the JSON forces every rate and decision to be recalculated. A stale or altered receipt is rejected instead of silently changing the accepted browser state.
What a benchmark can and cannot support
A compatible benchmark can show that one measured value is above, below, equal to or within a comparable source row. It can justify the next investigation.
It cannot prove:
- that the targeting reached the right accounts;
- that a click became a qualified lead;
- that a sales-accepted lead became pipeline;
- that the campaign influenced revenue;
- that the campaign is profitable.
Use the LinkedIn Ads Audit for a full account diagnosis, the LinkedIn Ads Cost Guide for budget planning, the ROAS Calculator for realized return and the Customer Acquisition Cost Calculator for matched acquisition economics.
If you want another operator to inspect the exported record and choose the first evidence-backed repair, bring it to Maestro's free Demand Gen Roast.
Sources and methodology
- LinkedIn: Campaign Manager reporting dashboard, including industry and self benchmarks.
- LinkedIn: performance metrics in Campaign Manager, including CTR, CPC, CPM and CPL definitions.
- LinkedIn: conversions and leads metrics, including conversion and Lead Gen Form completion denominators.
- LinkedIn: forecasted results, including inputs and limitations.
- Metadata: B2B advertising benchmarks.
- Metadata: benchmark methodology.
- Metadata: direct benchmark dataset, CC BY 4.0.
Sources were accessed on 6 October 2026. The public numeric table uses Metadata's 2025 spend-weighted aggregate rows. Dreamdata's public landing page did not expose metric-level tables or methods in the captured page, and ZenABM showed conflicting CPC and CPM values on the same report page, so neither source supplies numeric rows here.
No video is embedded on this page. The reader's task is source selection, denominator matching and reproducible comparison. The workspace and original diagrams complete those decisions without adding a separate playback step.