
CPC calculator for multiple rows
Enter one spend and click total for an immediate CPC. If you have several campaign, ad or period rows, use the full record to produce one result another person can reproduce.
Add compatible spend, add compatible clicks, then divide the totals. Do not average the CPC column in a report. That gives a tiny row the same weight as a row with most of the clicks.
Calculate one CPC now
This result is arithmetic. Add rows and definitions below before combining or comparing groups.
Cost per click
UnknownEnter spend and clicks.
Combine spend and click rows
Load the fictional paid-zero example or start blank. Group B is optional.
Loading blank record…
What to resolve
Technical record details and optional import
No technical decision
Record fingerprint: None
On this page
Calculate CPC from spend and clicks
Cost per click is total spend divided by the matching number of clicks:
CPC = spend / clicks
If a campaign spent $1,200 and recorded 400 matching clicks, CPC is $3.00.
The word matching matters. Spend and clicks need the same date window, population and click definition. A media-only spend total should not be combined with a fully loaded cost total. Link clicks should not be mixed with all clicks. Dollars should not be added to euros without a declared conversion outside this calculator.
The quick result answers the arithmetic question. Lead quality, profit and whether the click definition fits the decision need separate evidence.
Calculate combined CPC without averaging row CPCs
For several compatible rows, use:
Combined CPC = sum of spend / sum of clicks
Suppose one row spent $100 for 100 clicks. Its CPC is $1. Another spent $900 for 20 clicks. Its CPC is $45.
The simple mean of those row CPCs is $23. That is wrong for the combined result. The correct calculation is $1,000 / 120, or $8.33 per click.
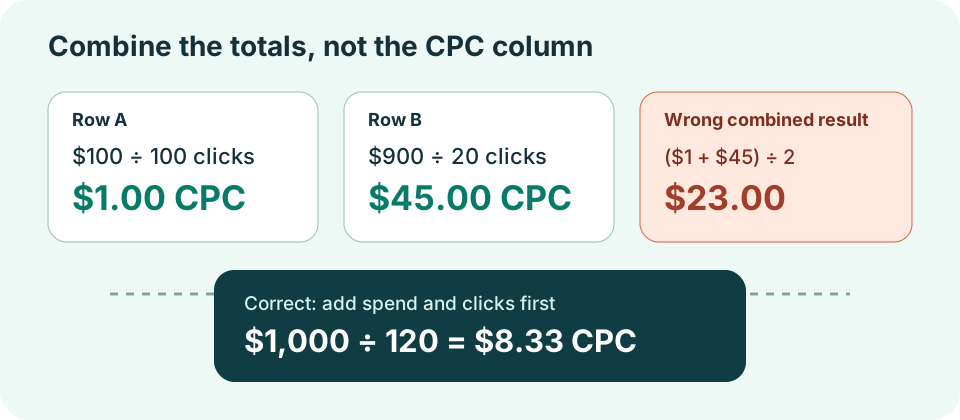
The full workspace keeps every row and displays the summed numerator and denominator beside the result. If a row does not belong in the group, hold it with a reason. Do not delete it just to make the total work.
Keep paid zero-click rows in the total
A paid row with zero clicks is not empty. It contains measured spend and a measured zero denominator.
Its row CPC is Unknown because division by zero has no finite answer. Its spend still belongs in a compatible aggregate. If one row spent $300 for zero clicks and another spent $700 for 100 clicks, the combined CPC is $1,000 / 100, or $10. Dropping the zero-click row would report $7 and hide $300 of spend.
The calculator keeps these states separate:
| Input state | Meaning | Treatment |
|---|---|---|
| Blank | Missing | Ask for the value or bind an evidence-backed exclusion. |
Unknown | Someone checked, but the value is unresolved | Keep the uncertainty visible. |
0 | Measured zero | Preserve it as evidence. |
| Invalid | The value breaks the accepted format or rule | Hold the row and name the repair. |
Missing clicks are not zero clicks. A negative spend is not a refund unless the record defines a separate correction policy. The calculator does not guess either one.
Decide which rows can be combined
Rows belong in one total only when these declarations match:
- Currency
- Cost basis
- Click definition and click mode
- Date window and time zone
- Population
- Source-row identity and coverage
The record also asks for a source and owner. Those fields turn “the platform says” into a repairable request: which export, which row and who can confirm it?
Use separate groups when you are comparing two non-overlapping periods. Keep the duration and population definition aligned. The comparison stays on hold if the groups overlap, use different currencies or count different clicks. Fix the mismatch before comparing them.
Compare CPC changes without claiming a cause
For compatible groups, the calculator reports two different answers:
- Absolute change: current CPC minus baseline CPC.
- Relative change: current CPC divided by baseline CPC, minus one.
If CPC moved from $10 to $8, the absolute change is -$2 and the relative change is -20%. A zero baseline can support an absolute change, but not a finite relative change.
These numbers describe what changed. They do not explain why.
Connect CPC to CPM and CTR
When the same rows include impressions, CPC can be reconstructed from CPM and CTR:
CPC = CPM / (CTR as a fraction × 1,000)
For $1,000 of spend, 10,000 impressions and 100 clicks:
- CPM is
$1,000 / 10,000 × 1,000 = $100. - CTR is
100 / 10,000 = 0.01, or 1%. - CPC is
$100 / (0.01 × 1,000) = $10.
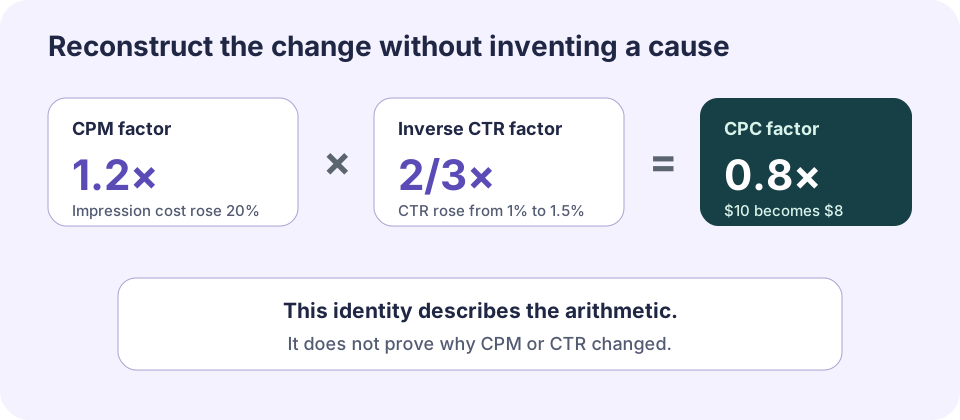
For two groups, the calculator can show the CPM factor and the inverse CTR factor. If CPM rises 20% while CTR rises 50%, the CPC factor is 1.2 × 2/3 = 0.8. CPC falls 20%.
That is an arithmetic association. It does not prove that an auction, audience, creative, placement or optimization setting caused the movement. Use the CTR calculator to inspect click response with the same definition and population. Use native platform evidence and controlled tests before naming a cause.
What is a good CPC?
There is no universal good CPC. A cheap click that produces no accepted leads can be worse than an expensive click that reaches the right buyer.
Start with compatible evidence:
- Compare the same platform, format, objective, click definition and audience over non-overlapping periods.
- Check whether CPM, CTR or both changed arithmetically.
- Carry the record to the cost per lead calculator and use raw, accepted and qualified lead counts.
- Use the LinkedIn ads benchmarks only when the source, period, objective and definitions are genuinely comparable.
- Use the customer acquisition cost calculator when the decision is about fully loaded customer cost.
CPC helps reconcile media delivery. It is not a verdict on lead quality, pipeline or contribution.
Export a reviewable CPC record
After checking the full record, download the format that fits the next person:
- JSON preserves the complete source record and is the canonical reimport format.
- CSV lists every source and decision field as
path,valuerows for audit. - Markdown gives a readable handoff and includes the exact JSON source in a fenced block.
The fingerprint binds a review to the current rows and definitions. Change a bound source field and the prior approval becomes stale. Import validation is atomic: malformed JSON does not replace the last accepted record.
Use the blank CPC record when you want to prepare the inputs elsewhere. Open the worked fictional record to see the retained zero-click row, visible totals and evidence requests. Download the build prompt to reproduce the calculation in another tool, and the review prompt to challenge the grouping and claims without article context.
The portable CPC execution bundle runs the same evaluator without this article. Extract the ZIP, open a terminal in the extracted folder, and run node run-cpc.mjs downloads/cpc-record-worked-fictional.json --pretty. The command should return the fictional $10.00 CPC, retain the paid zero-click row and list any evidence request. Replace the worked JSON with your completed record only after you confirm the definitions and source coverage.
The export authorizes calculation and review only. It does not authorize a budget or live campaign change.
Use the result in the next review
For recurring reconciliation, carry the source paths and definitions into the Facebook Ads reporting template. For lead-stage economics, move to the CPL record rather than trying to infer quality from CPC.
If you want another person to inspect the grouping, definitions and downstream handoff, book a free Demand Gen Roast. Bring the exported record. The conversation starts with the exact rows, not a screenshot of one blended number.