
CTR calculator for multiple rows
Enter clicks and impressions for one fast result. Add report rows when you need the combined CTR for the whole export. The calculator sums the counts first, so a small row does not get the same weight as a large one.
Calculate one CTR now
This result is arithmetic. Add report rows and definitions below before comparing groups.
Click-through rate
UnknownEnter clicks and impressions.
Combine report rows
Load the unequal-row example or start blank. Group B is optional.
Group A
Group B
Loading blank record…
What to resolve
Technical record details and optional import
No technical decision
Record fingerprint: None
If one ad has 90 clicks from 1,000 impressions, its CTR is 9%. If another has 110 clicks from 9,000 impressions, its CTR is 1.2222%. The combined result is not the average of 9% and 1.2222%. Add the counts: 200 clicks ÷ 10,000 impressions × 100 = 2%.
On this page
Calculate CTR from clicks and impressions
CTR means click-through rate. Google Ads defines it as clicks divided by impressions. Multiply by 100 to display the result as a percentage.
CTR = clicks ÷ impressions × 100
For 120 clicks and 10,000 impressions, CTR is 1.2%. Zero clicks from 10,000 impressions is a known 0%. Zero impressions is different: there is no usable denominator, so CTR is Unknown. A blank click field is Missing, not zero.
The quick calculator is enough for one clean pair of counts. Use the row workspace when your export contains campaigns, ads, dates, placements or other report lines.
Combine rows before you average anything
To calculate one CTR for several rows, add all clicks and add all impressions. Then divide the two totals.
| Fictional row | Clicks | Impressions | Row CTR |
|---|---|---|---|
| Small row | 90 | 1,000 | 9.0000% |
| Large row | 110 | 9,000 | 1.2222% |
| Combined | 200 | 10,000 | 2.0000% |
The simple mean is (9% + 1.2222%) ÷ 2 = 5.1111%. That number treats 1,000 impressions and 9,000 impressions as equal-sized opportunities. The combined CTR is 2.0000% because every impression receives the same weight.
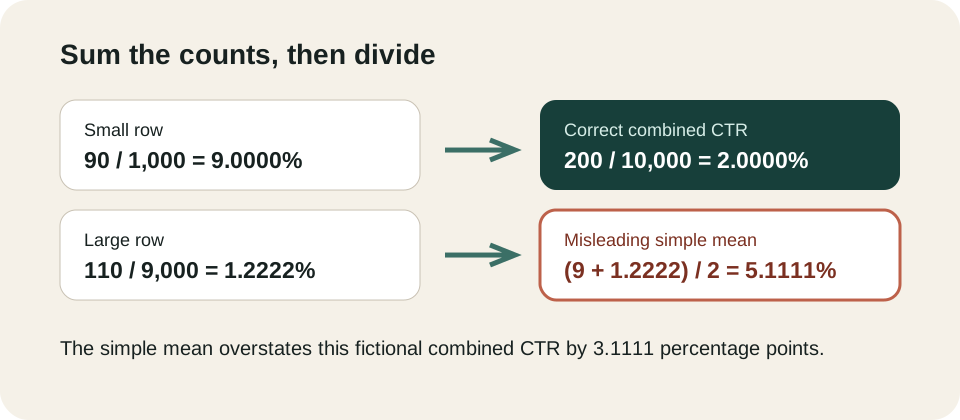
Sum the counts, then divide. If you only have percentages and not their impression counts, you cannot reconstruct the combined CTR. Ask the report owner for clicks and impressions for each row.
Keep the click and impression definitions attached
“Clicks” can mean different things in different reports. One export may use all clicks. Another may use link clicks. A third may count unique clicks. Impressions may be served, viewable or another platform-defined event. The formula stays the same, but the result answers a different question.
Name these fields before you compare anything:
- Click definition: the exact click metric used.
- Impression definition: the exact opportunity count used.
- Date window and time zone.
- Population: campaigns, ads, placements, messages or another bounded group.
- Source: report, query or file someone else can inspect.
- Owner: the person who can answer a definition or extraction question.
The workspace keeps these fields beside the rows. A valid number can still be held for review when the definitions are missing.
Compare two compatible groups
A CTR comparison needs the same click definition, impression definition, window treatment and population rule. If Group A uses link clicks and Group B uses all clicks, the difference mixes a definition change with performance. The calculator holds that comparison until the definitions match or the scope is explained.
For compatible fictional groups:
- Group A: 200 clicks / 10,000 impressions = 2.0%
- Group B: 250 clicks / 10,000 impressions = 2.5%
- Difference: +0.5 percentage points
- Relative change: +25%
Percentage points and percent change are not the same unit. The move from 2.0% to 2.5% is half a percentage point. Relative to the 2.0% starting rate, that half point is a 25% increase.
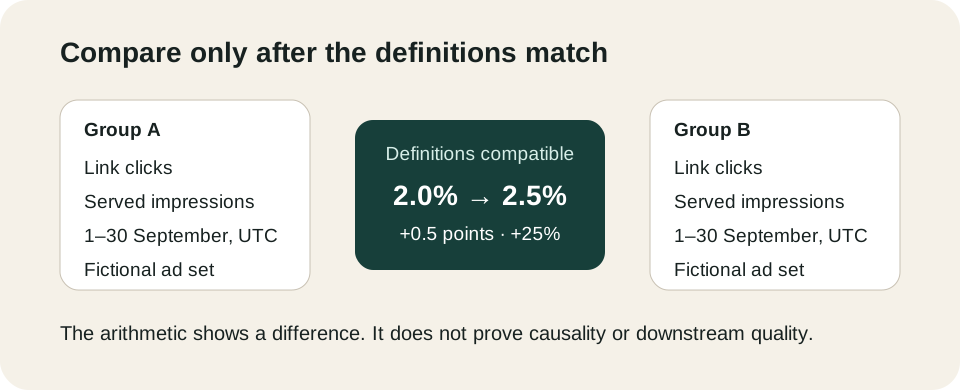
The difference does not prove that the ad caused a better business result. Audience, placement, auction, timing and creative can all change. CTR also stops at the click. Check lead quality, qualified pipeline and revenue separately before changing spend.
Handle zero, missing and impossible rows
A blank can change the decision when it quietly becomes zero.
| Input state | What it means | CTR treatment |
|---|---|---|
| 0 clicks, positive impressions | Measured zero clicks | 0.0000% |
| Blank clicks | Count not supplied | Missing; hold |
Unknown clicks | Source cannot resolve the count | Unknown; hold |
| Positive clicks, 0 impressions | No usable denominator | Unknown; hold |
| Negative or fractional count | Invalid count | Invalid; hold |
| Clicks above impressions under a unique-click definition | Definition conflict | Invalid until explained |
Some all-click or repeat-click definitions can produce more clicks than impressions. Do not “fix” the count. Choose the repeat-click definition in the workspace and explain it. If the report is supposed to use unique clicks, clicks above impressions need correction.
Export a CTR record another operator can check
Download JSON for exact reimport, CSV for row review and Markdown for a readable handoff. The Markdown lists every row, total, definition, comparison rule, unresolved request and fingerprint before the canonical JSON appendix. The readable section should stand on its own. The JSON appendix is there for exact reimport.
The blank CTR record and completed fictional record use the same contract as the browser. The standalone execution bundle contains the evaluator, fixtures and command-line runner. The build prompt and review prompt preserve missing and zero states outside this page.
A fingerprint changes when a row, definition or source changes. A prior approval does not travel to the new fingerprint.
What counts as a good CTR?
There is no universal good CTR. Google Ads notes that a good CTR depends on what you advertise and the network. Compare against the same platform, format, audience and objective. For LinkedIn-specific context, use the LinkedIn ads benchmarks page and separate public reference points from your own account history.
A higher CTR can still produce worse leads. Use the cost per lead calculator to carry raw, accepted and qualified lead definitions into the cost discussion. Use the Facebook Ads reporting template when the task is recurring platform-to-CRM reporting.
If you want another person to inspect the metric definitions and source path, book a free Demand Gen Roast. Bring the exported record. The useful conversation starts with the exact rows and definitions, not a screenshot of one percentage.