
Facebook Ads Attribution: Explain the Numbers Before You Change the Budget
Meta, GA4, and your CRM can each show a different number for the same campaign. Start by writing down what each number counts. Meta credits a conversion to an ad under an attribution model and window. Analytics records activity under its own rules. Your CRM may count unique people, qualified leads, opportunities, or customers. These totals can all be internally consistent while answering different questions.
For a B2B campaign, the practical job is to freeze one comparison, find the part of the difference you can explain, and decide what to check next. Do not move budget because one dashboard has the largest number.
What Meta attribution can tell you
An attribution setting tells Meta which ad interactions and subsequent conversion events qualify for credit. A window sets the time allowed after the interaction. A model determines how Meta reports credit. A conversion count decides whether the report shows the first qualifying conversion or all qualifying conversions. The event is what happened, such as Lead or Purchase. The report period selects the dates you are looking at. Those are separate choices.
An attributed lead is an event credited under those rules. It is not automatically a unique person, a sales-qualified lead, or a lead caused by the ad. Meta itself says incrementality experiments, including Conversion Lift, are the best way to answer what outcomes an ad caused that would not otherwise have happened. Meta's measurement announcement makes that distinction explicit.
What changed in 2026
In March 2026, Meta announced that click-through attribution for website and in-store conversions would count link clicks only. Previously, other ad clicks, such as a share or save, could qualify as clicks. Meta said it would move conversions following non-link actions into the category renamed engage-through attribution. It also changed the qualifying video-view threshold from 10 seconds to 5 seconds. The rollout started later that month for campaigns optimizing for website or in-store conversions, at different times for different advertisers. Meta said billing would not change.
That announcement is a reason to check the definitions shown in your account, especially when comparing reports across the rollout. It does not prove that every historical row was recalculated or that every account changed on the same day. Record the ad set's actual attribution model, settings, and event instead of copying a supposed universal default from an older article.
Check the native attribution columns
Jon Loomer's June 2026 Ads Manager walkthrough describes two controls that answer different questions. The labels and available options can vary by account and configuration, so verify them in your own Ads Manager before using the numbers in a decision.
- Select the account, campaign or ad set, report dates, and conversion event. Record the account timezone and the exact scope. Note whether the Results column and any custom conversion column show the same event.
- At the ad set, record the attribution model, attribution setting, and conversion count used for default reporting. Do this before opening comparison columns. The default Results number gets its meaning from those settings.
- In Breakdown, inspect Attribution settings. Under the Standard model, Loomer shows rows for one-day click, days 2–7 click, one-day engagement, and one-day view. These rows explain which configured settings contributed to default results; a row's appearance alone does not mean it contributed conversions. Also inspect Conversion count for First Conversion and All Other Conversions when the option applies.
- From Columns, open Compare Attribution Settings. Add the available one-day and seven-day click columns, then the relevant view, engagement, 28-day click, alternate model, or First/All count columns. Loomer shows that this tool can expose results outside the ad set's default reporting setting. Label each exported number with its own event, window, model, and count basis.
- Export or save the comparison with a capture time and a data snapshot identifier. If you pull another report later, establish that it contains the same underlying data before treating a difference as a setting effect. A later capture time is fine when the underlying snapshot is demonstrably the same. If events arrived or changed, start a new comparison.
For campaign operations beyond this interpretation, use the Facebook ads reporting template to reconcile source rows, grain, and joins. This page stays with the meaning of the native attribution numbers.
A fixed-snapshot example
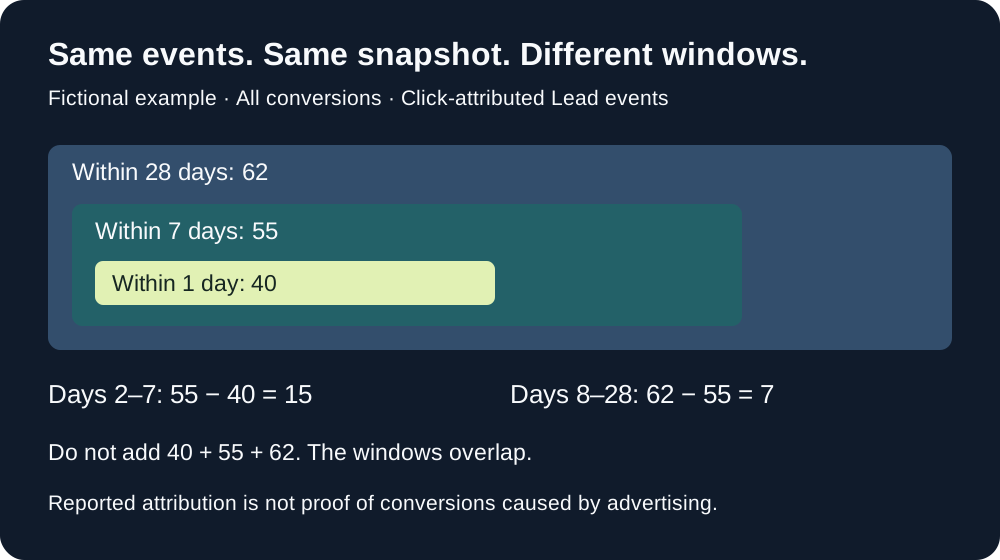
Suppose a fictional B2B lead campaign has one fixed Ads Manager snapshot. The same Lead event, ad set, Standard model, All Conversions count basis, report dates, timezone, and underlying event data are held constant. Its comparison columns show:
Swipe to read all columns, or focus the table and use the arrow keys.
| Click-through window | Reported Lead events | What you can calculate |
|---|---|---|
| One day | 40 | Within one day of a qualifying click |
| Seven days | 55 | 15 more than the one-day column |
| 28 days | 62 | 7 more than the seven-day column |
The windows are nested. The seven-day figure includes the one-day figure; the 28-day figure includes both shorter windows. Adding 40 + 55 + 62 would count the same qualifying events repeatedly. Under the fixed conditions above, 55 − 40 = 15 is the additional count in days 2–7, and 62 − 55 = 7 is the additional count in days 8–28. These are differences in attributed event counts, not 15 or 7 newly proved customers. The 28-day column is a reporting comparison where available; its presence does not establish that 28-day click is an optimization option in the ad set.
Now change the seven-day column to First Conversion while the one-day column remains All Conversions. Subtracting those two numbers no longer isolates days 2–7. The one-day figure can include repeat conversions that the seven-day figure excludes. Make the count basis match, or leave the spread uncalculated.
The same rule applies to refreshed data. If Monday's one-day count is 40 and Tuesday's seven-day count is 55 after more events have arrived, the 15-event difference mixes time-window and data changes. Reopen both columns on one proved snapshot. Capture timestamps alone do not tell you whether the underlying data changed.
Scroll horizontally or use the arrow keys to read the diagram.
What practitioner examples show, and what they do not
Loomer's Compare Attribution Settings article, published in November 2025 and updated in April 2026, gives three reporting examples. Each comes from his historical account setup, not a Maestro campaign.
When purchases arrived after the first day
He shows 37 one-day click purchases and 46 seven-day click purchases in one comparison. The matching seven-day column includes the one-day purchases, so 9 more purchases appear in days 2–7. If your own split looks similar, check the purchase event and both column definitions before discussing the buying cycle. The difference shows timing under an attribution rule; it does not prove that the ads caused nine additional purchases.
When every registration was view-through
In a separate example, all 23 reported registrations were view-through. A report that says “23 registrations” leaves out the interaction type. A view-through registration means the report credited an impression without a qualifying click. Check the click, engage-through, and view columns for the same registration event, then compare the registrations with your own source and CRM records. The view-through label alone does not establish incremental registrations.
When purchases appeared in a longer reporting window
In a lead-generation example, Loomer found 6 purchases in a 28-day click comparison when default reporting showed none. That tells the reader to check a later purchase event after a lead campaign, with the window named. It does not turn six purchases into a verified return on ad spend; that would require matching the right purchases, costs, and business records. His 28-day reporting discussion describes a reporting column in his dated setup, not a generally available 28-day optimization setting.
All three examples show why the default total needs context. None establishes that the ads caused the recorded purchases or registrations, that a longer window would improve another campaign, or that the same options are available in every account.
A conversion count is not a headcount
In his June 2026 walkthrough, Loomer shows 496 results split into 275 first conversions and 221 other conversions. The split reconciles: 275 + 221 = 496. These are disjoint rows in that conversion-count breakdown, unlike the overlapping click windows above.
Scroll horizontally or use the arrow keys to inspect the original labels.
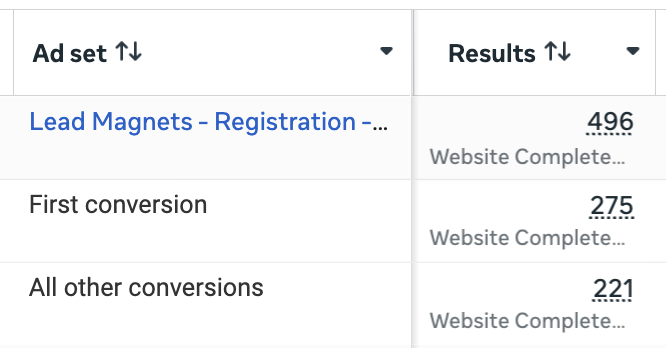
The cropped source shows a truncated registration event label. It does not show the full account scope, reporting dates, or CRM identities. Use it to understand the First/Other distinction, then verify your own event definition and source rows before calling a total unique leads.
Why Meta, GA4, and CRM totals differ
Start with the unit. A Meta Lead event may be counted again when a person submits another form or completes another qualifying action. Loomer shows that Ads Manager can separate First Conversion from All Other Conversions. A CRM report of distinct contacts uses a different unit. Even a Meta First Conversion column should not be renamed “unique CRM people” without a verified identity match and the same inclusion rules.
Next check the interaction and time rules. Meta's native click, engage-through, and view-through categories do not necessarily match the way a web analytics report assigns a session or conversion to a channel. Meta's 2026 link-click change was intended to narrow one source of mismatch with third-party tools. It did not promise identical totals. The Graygency's attribution overview also discusses why platform and analytics views diverge; use the actual settings and report definitions in your own systems for the specific reconciliation.
Then check the funnel stage. A form submission, a qualified lead, and a closed deal happen at different times and may belong to different populations. Compare Meta Lead events to the corresponding raw lead events first. Move to CRM qualified leads only after you have defined how an event maps to a person and what disqualifications or duplicates the CRM applies. Our reporting template covers that row-level work.
Standard, Incremental, and causal impact
Loomer's June 2026 reporting guide distinguishes Meta's Standard and Incremental attribution models. In his walkthrough, Standard results can be broken down by configured click, engagement, and view settings. He shows that Compare Attribution Settings can display an alternate model's results even when the ad set uses the other model. Record which model each column uses; do not present a Standard-versus-Incremental gap as a simple count of leads an ad caused.
An Incremental reporting label is still a modeled report. Meta's own explanation points to incrementality experiments for the causal question. If the budget decision depends on whether the ads created outcomes that would otherwise not exist, plan an appropriate experiment. A dashboard comparison can identify a question for that test; it cannot substitute for the test.
Finish with a decision memo
Copy this table into the review document and fill it from one comparison. “Unknown” is better than a precise-looking subtraction built on different units.
Download the blank comparison, worked comparison, and standalone review prompt to carry the same review into a meeting or another tool. Give the prompt the scope, snapshot proof, metric definitions, and decision question recorded below.
Swipe to read all columns, or focus the table and use the arrow keys.
| Field | Record |
|---|---|
| Account, campaign/ad set, and event | |
| Report dates, account timezone, and capture time | |
| Underlying data snapshot and proof of sameness | |
| Default model, attribution setting, and conversion count | |
| Comparison model, window, count basis, and each result | |
| GA4 metric, attribution definition, and date basis | |
| CRM object, stage, unique-person rule, and date basis | |
| Difference explained by matched native columns | |
| Difference still unknown | |
| Next check or test, owner, and decision date |
For the fictional 40/55/62 example, a defensible memo would say: “On one fixed Lead-event snapshot, the seven-day click column contains 15 more attributed events than the one-day click column, and the 28-day reporting column contains 7 more than the seven-day column. We have not matched these events to unique CRM contacts or tested causal lift. Keep the current budget decision separate from this window comparison. Next, verify the CRM join and count basis, then decide whether an optimization test is warranted.”
If the difference is a missing event or mismatched setup, start with a Facebook ads audit. If the question is how to change delivery after the measurement is clear, read the bid strategies guide. If you want another set of eyes on the account, bring the completed comparison to a free Demand Gen Roast.
Review your attribution comparison
Copy this prompt into your AI tool. Paste your completed comparison worksheet after the prompt. Open the plain-text prompt to select it directly.