
Facebook ads benchmarks for 2026: find a reference you can actually use
If you need a public Facebook ads benchmark, start with the campaign objective. WordStream and LocaliQ's 2026 study reports a median 1.93% click-through rate (CTR) and $0.60 cost per click (CPC) for traffic campaigns. For leads campaigns, it reports 2.70% CTR, $1.80 CPC, 8.54% conversion rate, and $27.39 cost per lead (CPL). These are all-industry figures for US campaigns, reported in USD. They are a reference for those objectives, not a B2B target or a promise about your next campaign.
The source also publishes industry rows. Pick the objective first, then the closest stated industry. Record what the source measured before putting your account number beside it. If the click, conversion, or attribution definition is missing, show the public figure as context and use a matched cohort from your own account for the actual difference calculation.
The 2026 figures by objective
Swipe to read all columns, or focus the table and use the arrow keys.
| Objective in WordStream/LocaliQ | Industry row | CTR | CPC | Conversion rate | CPL |
|---|---|---|---|---|---|
| Traffic | All industries | 1.93% | $0.60 | Not reported | Not reported |
| Traffic | Business Services | 1.64% | $0.70 | Not reported | Not reported |
| Traffic | Industrial & Commercial | 2.06% | $0.54 | Not reported | Not reported |
| Leads | All industries | 2.70% | $1.80 | 8.54% | $27.39 |
| Leads | Industrial & Commercial | 2.57% | $1.55 | 4.50% | $35.87 |
| Leads | Education & Instruction | 1.74% | $1.72 | 15.87% | $26.31 |
Source: WordStream/LocaliQ, “Facebook Ads Benchmarks 2026”, published September 14, 2026, and visibly marked last updated September 15, 2026; retrieved October 31, 2026. Its traffic sample contains 1,377 US campaigns and its leads sample contains 452 US campaigns, both running from April 1, 2025, through June 30, 2026. Each traffic subcategory has at least 11 active campaigns; each leads subcategory has at least four. The report calls the numbers “averages” in its tables but says in its methodology that they are medians. Currency is USD.
These rows are a selection from its published tables, not a B2B SaaS segment. Business Services appears in the traffic table but not the leads table. Industrial & Commercial is its own category, not a stand-in for every B2B advertiser.
There are two catches to doing arithmetic with this table. The article does not pin down the exact click used for CTR and CPC, the exact conversion event and denominator used for conversion rate, or the attribution settings behind a lead. And its reported medians are separate summaries. Dividing its median CPC by its median conversion rate does not reproduce median CPL: $1.80 ÷ 8.54% is about $21.08, while the reported all-industry median CPL is $27.39. Those are different statistics, not a broken funnel. Use each reported number on its own terms.
A second original dataset gives a different kind of reference. HelloConversions' Meta benchmark, updated October 2026, reports January–September 2026 account medians for businesses connected to GoHighLevel: 2.1% link CTR, $2.13 per link click, and $37 per reported lead or completed registration. It also shows the middle half of accounts: 1.5%–2.6% link CTR, $1.18–$2.98 link CPC, and $19–$85 CPL. Each account counts once.
HelloConversions does not disclose its account count or give an objective, geography, or B2B industry split. Its lead count takes the greater of leads and completed registrations on each ad-day. Its figures and WordStream's use different populations, units of analysis, event definitions, and reporting windows. Keep their values in separate records.
For B2B SaaS specifically, Aimers' 2026 guide already separates these public objective medians from SaaS planning figures and CRM outcomes. Its advice makes the right problem clear: a $40 content download and a $150 sales-qualified lead are different events. A public industry row can help you ask a better question. Your recent, matched account cohorts tell you what changed in your funnel.
How to choose a benchmark row
Say you sell industrial equipment and run a Meta leads campaign for quote requests. The Industrial & Commercial leads row is a sensible public row to inspect: it names the same broad objective and a closer industry than an all-industry total. It still does not tell you whether WordStream's “lead” equals your quote request, whether its conversion denominator equals yours, or how later CRM qualification was counted. Put the row in your review as descriptive context. Do not report that your campaign is 20% above or below the industry until the measures match.
If you sell software, do not relabel that Industrial & Commercial row “B2B SaaS average.” Choose an external row for its stated scope, then compare two of your own cohorts that share the same objective, offer, event, geography, currency, attribution setting, and reporting window. If any of those changed, describe the change before you calculate a gap. The Facebook ad objectives guide helps separate the goal you selected in Meta from the outcome you ultimately care about.
For another public view, Superads describes a benchmarking tool that can filter CPC, CPM, and CTR by industry, country, and campaign type. Its April 14, 2025, article says the tool uses more than $2 billion in anonymized spend from thousands of accounts. Its article is a tool description; it does not give a stable row value or all the definitions needed for a comparison here. If you use a live tool result, save the selected filters, value, date, and definitions with your review.
Follow the decision steps from top to bottom.
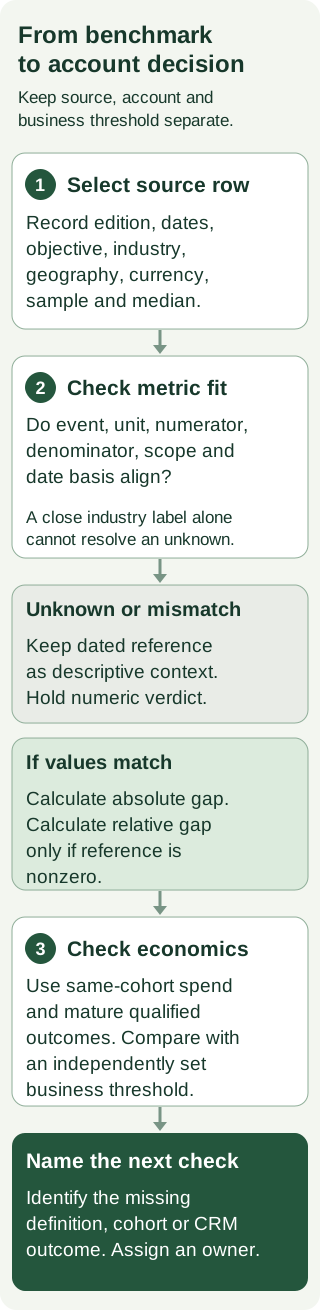
The decision is straightforward: Can you identify the same event, unit, population, scope, and time basis on both sides? If yes, calculate the absolute difference and, when the reference is nonzero, the relative difference. If no, keep the source value visible and mark the calculation “held.” A missing definition is an unknown, not proof that the account performed better or worse.
Compare matched account cohorts before changing a campaign
Here is a fictional B2B example. Both cohorts are US Meta leads campaigns promoting the same demo request. They use the same qualified-lead rule, CRM join, attribution setting, and 30-day reporting length.
Swipe to read all columns, or focus the table and use the arrow keys.
| Own-account cohort | Spend | Qualified demo requests | Qualified CPL | Qualified share of submitted demos |
|---|---|---|---|---|
| Earlier | $6,000 | 30 | $200 | 30% of 100 submissions |
| Later | $7,200 | 40 | $180 | 40% of 100 submissions |
The later qualified CPL is $20 lower per qualified lead, or 10% lower relative to the earlier $200. The qualified share rose from 30% to 40%: an absolute change of 10 percentage points, or a 33.3% relative increase from 30%. Percentage points and relative percent are different units; give both when you compare rates.
The fictional business supplied a $190 maximum qualified CPL from its own unit economics. On this one measure, the later cohort is $10 below that threshold. Both cohorts allow seven days for attributed requests and another seven days for CRM qualification; the final export is October 15 after the September cohort closes. This comparison does not establish opportunity quality or future volume.
Do not swap the $27.39 public raw CPL into that calculation. A public lead and a CRM-qualified demo request are different events. The Facebook ads reporting template can help you retain the campaign and CRM counts in one reporting sequence, while the attribution guide covers the crediting rules that need to stay fixed across cohorts.
Raw CPL can also point the wrong way. Here is a second fictional comparison, using the same offer, CRM rule, geography, attribution, and mature reporting period.
Swipe to read all columns, or focus the table and use the arrow keys.
| Campaign | Spend | Form submissions | Raw CPL | Qualified submissions | Qualified CPL |
|---|---|---|---|---|---|
| A | $4,000 | 100 | $40 | 10 | $400 |
| B | $4,800 | 80 | $60 | 24 | $200 |
Campaign A costs $20 less per raw form. It costs $200 more per qualified lead. If the business supplied a $250 maximum qualified CPL from its own unit economics, B meets it and A does not. WordStream's public median did not set that ceiling.
Zero and missing counts need their own treatment. A third fictional cohort spends $500 and has a verified zero qualified leads after the stated maturation window. Its qualified CPL is not a finite dollar amount; report spend and zero outcomes, then investigate. If the CRM has not finished receiving or qualifying leads, the outcome is unknown, which is different from verified zero. If both spend and leads are zero, the ratio 0 ÷ 0 is undefined. A blank count is never zero by default.
Keep a record that survives the next reporting cycle
Download the blank benchmark review and four worked reviews. They capture the source, the row you selected, every definition you can verify, the account cohort, the comparison decision, and the next check. You can also paste the benchmark review prompt into an assistant with your completed record. The prompt asks for missing information instead of silently filling it in.
Review your benchmark evidence
Fill in the blank benchmark review, using the worked records as examples. Copy this prompt into your AI tool, then paste your completed record. Open the plain-text prompt to select it directly.
Read or select the full prompt
Start with one campaign and one metric. Save its public reference, then build a matched earlier account cohort. Use the Facebook ads cost calculator when you need to explore spend and outcome assumptions; keep those projections separate from the observed cohort. If your raw CPL looks strong but qualified CPL misses your independently supplied ceiling, the next check is the lead-to-CRM join and qualification rule before changing bids or creative. If you want a second set of eyes on the campaign and its CRM path, book a Demand Gen Roast. Bring the completed review so we can start with the event and outcome that matter to your business.
Frequently asked questions
What is a good Facebook ads CTR in 2026?
WordStream/LocaliQ reports 1.93% for US traffic campaigns and 2.70% for US leads campaigns in its 2026 dataset. Business Services traffic is 1.64%; Industrial & Commercial leads is 2.57%. Those are objective and industry references. Check which clicks your account CTR counts before calculating a difference.
What is a good Facebook ads CPC in 2026?
The same report lists $0.60 for traffic campaigns and $1.80 for leads campaigns across industries, in USD. Its Business Services traffic row is $0.70 and Industrial & Commercial leads row is $1.55. Keep the objective and click definition with every CPC you save.
What is a good Facebook ads CPL in 2026?
The report's all-industry leads median is $27.39; its Industrial & Commercial leads value is $35.87. Neither is a qualified B2B lead price. Calculate your raw CPL and qualified CPL from the same dated cohort, then compare qualified CPL with the ceiling your business supplied.
Why doesn't CPC divided by conversion rate equal the published CPL?
WordStream/LocaliQ reports medians for each metric separately. Its all-industry lead median CPC divided by median conversion rate gives about $21.08, while its median CPL is $27.39. Medians do not combine like one campaign's spend, clicks, and leads. The report also leaves the exact conversion denominator unspecified.